Do as I Say, or Do as I Do?

I include this chart in most of my speeches on asset allocation as it shows just how wrong the crowd can be at EXTREMES.  People were most bullish in literally the worst month ever, and most bearish at the exact BOTTOM.

Why they are all so bearish now I have no idea.  It is in the bottom 3% of all readings, which historically means returns of 15% in the following year.  Readings below 20% bulls are on average 20% a year!
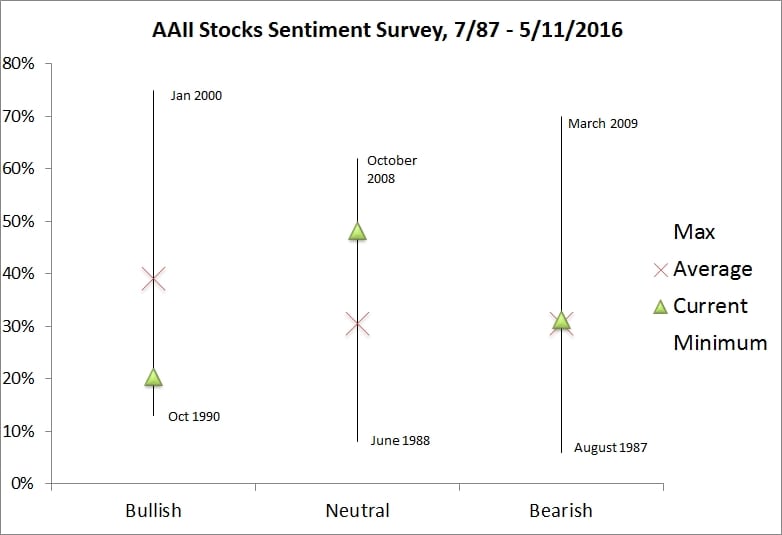
Chart of the AAII investor sentiment survey, 1987 to 2016: bullish, neutral and bearish readings with their highs, lows, averages and current levels


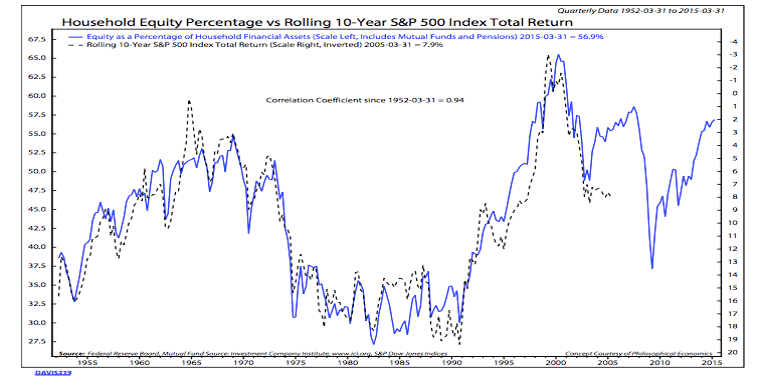
Now, on the flip side people are actually heavily allocated to equities.  (This is likely due to drift.) And this has historically been very bearish for stocks….

So, which is going to win out: Do what I say, or Do what I do?
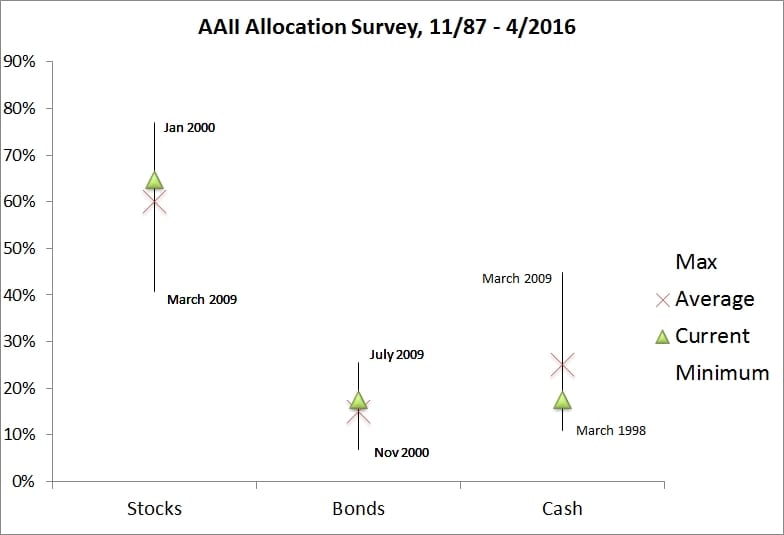
 

Chart of the AAII asset allocation survey, 1987 to 2016: stock, bond and cash allocations with their highs, lows, averages and current levels


Ned Davis chart of household equity allocation against the rolling 10-year S&P 500 return (inverted), 1952 to 2015, moving closely together


Copyright 2016 Ned Davis Research, Inc. Further distribution prohibited without prior permission. All Rights Reserved.

See NDR Disclaimer at www.ndr.com/copyright.html. For data vendor disclaimers refer to www.ndr.com/vendorinfo/.

Ready to Start Investing with Confidence?

Join thousands of investors who choose evidence over emotion.

Cambria Investment Management, L.P.
3300 Highland Avenue
Manhattan Beach, CA 90266

Scroll to Top

Download four of Meb’s books for free by filling out the form below.

You are now leaving cambriainvestments.com and entering cambriafunds.com. 

The Cambria ETFs are distributed by ALPS Distributors Inc., 1290 Broadway, Suite 1000, Denver, CO 80203, which is not affiliated with Cambria Investment Management, LP, the Investment Adviser for the Fund.